
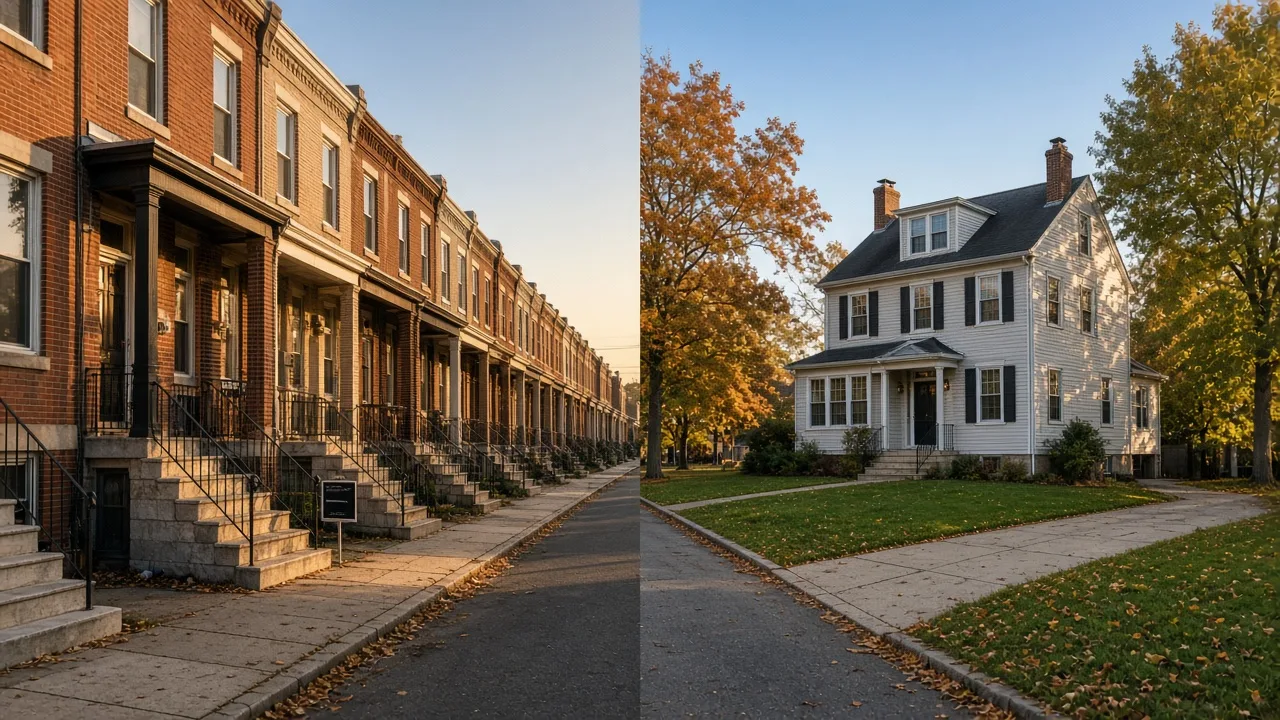
Philadelphia's citywide median sale price runs well below every county around it, and the gap is mostly what the city is built from: hundreds of thousands of attached rowhouses on small parcels, most older and smaller than the detached houses on suburban lots, priced against a city wage tax and the region's highest transfer tax. Verified November 2026.
I'm Craig Lerch, a broker at eXp Realty who handles relocation searches across the metro, and this is the first question most out-of-town buyers ask after they see the listing feeds. Everything here was verified in November 2026 against city tax pages, Census housing data, and current market reports. Price reads vary by source and quarter, so the numbers below are ranges, with the source and verification month noted.
The numbers: the city against its collar counties
Citywide median sale prices in late 2026 sat roughly as follows. Philadelphia: about $250,000 to $295,000, reading about $274,800 on Redfin's October 2026 citywide median and about $250,000 on the Bright MLS second-quarter raw median (verified November 2026). Montgomery County: about $430,000 to $475,000 (Redfin, 2026). Chester County: about $556,000 to $560,000, the highest of the four. Bucks County: about $510,000 to $540,000. Delaware County: about $349,000 to $370,000. On those reads, the city median sits roughly half of Chester's and Bucks', about 40 percent below Montgomery at its high end, and about a quarter below Delaware County.
The steepest single step is the Main Line, the string of towns in eastern Montgomery County along the rail line. 2026 local brokerage reports commonly put Main Line town medians between about $650,000 and $850,000, more than double the city median for a ride of roughly 40 minutes to Center City (PHL Property Collective, verified November 2026). A single rail line crossing several hundred thousand dollars of median in under an hour of travel is a gradient few metro areas have.
Why the city is cheaper: it is the stock, not the neighborhood
The first and largest reason is what the city is made of. Philadelphia is the United States city most dominated by attached housing: rowhouses are roughly 56 to 60 percent of city units (60.1 percent in the 2010 Census, about 56 percent in recent Census ACS figures), and the Center for Architecture and Design counts about 70 percent once multi-unit row buildings are included (verified November 2026). The typical rowhouse runs 900 to 1,400 square feet with two or three bedrooms on a narrow lot, and about 41 percent of the city's housing units were built before 1940 (Census ACS, verified November 2026).
The collar counties are the mirror image. Their stock is dominated by detached single-family houses on lots, newer on average, and larger. Chester and Bucks hold the newest housing in Pennsylvania, with median construction in the 1980s and 40 to 50 percent of their stock built since 1980, and typical new single-family suburban construction runs about 2,200 square feet (PA Association of Realtors and Census ACS, verified November 2026). Comparing a 1,100-square-foot rowhouse with a 2,200-square-foot detached house on a lawn is comparing two different products, and the price moves with the product, not with any judgment about either block.
Supply structure reinforces the level. The city's housing was built for a population larger than today's, so the attached inventory is deep and turns over at lower price points, while the collar counties keep adding large new detached homes each year. That mix, not a verdict about any address, is what pulls the citywide median below the county medians.
The taxes priced into the city's listings
The tax map runs the opposite way from the sticker price, and it is part of the explanation. Philadelphia levies a wage tax on income earned in the city, 3.735 percent for residents and 3.425 percent for non-residents who work in the city, effective July 1, 2026, with a further step down scheduled for July 1, 2027 (phila.gov, verified November 2026). Collar-county municipalities levy their own earned income tax under state Act 32, typically about 1 percent, a fraction of the city's rates (Pennsylvania DCED, verified September 2026).
The city's realty transfer tax is also the region's highest at 4.578 percent (3.578 percent city plus 1 percent state), usually split near evenly, so a buyer writes about 2.3 percent of price at closing, versus roughly 2 percent total in most suburban Pennsylvania towns (phila.gov, verified November 2026). Property taxes point the other way: the city's posted rate is 1.3998 percent of assessed value (0.6159 percent city plus 0.7839 percent school district), and because Philadelphia assesses close to market value, the effective rate lands near 0.8 to 0.9 percent for most owners with the $100,000 Homestead Exemption applied (phila.gov and 2026 effective-rate estimators, verified November 2026). The collar counties run higher: Montgomery around 1.35 to 1.44 percent effective, Chester around 1.30 to 1.34, Bucks about 1.31, and Delaware County near 1.84 (verified September to November 2026).
Here is the part a national listicle will not tell you: the two tax machines pull on price in opposite directions. A wage tax and a 4.578 percent transfer tax are costs a buyer sees at the offer and at the closing table, and buyers discount them into what they will pay, which presses the city's sale prices down. High suburban effective property rates are a carrying cost built into the monthly budget, and they press suburban prices down from where they would otherwise sit. Both effects are part of why the gradient looks the way it does, and neither one makes any address automatically cheap or expensive. The honest math for your income, your down payment, and a specific house belongs in a spreadsheet, or with a CPA; this post is general information, not tax advice.
How the gradient changes across the metro
The city-versus-suburbs step is the steepest, and the pattern keeps holding across the river with smaller steps. South Jersey's Camden County ran about $385,000 for all home types in the third quarter of 2026, and Burlington County about $405,000 in September 2026 (verified November 2026). New Castle County, Delaware ran about $380,000 to $400,000 in mid-2026 (Realtor.com and Redfin, verified November 2026), and Delaware County, Pennsylvania sits closest to the city at about $349,000 to $370,000. So the city median stays below every county in the metro, the gap ranging from about 25 to 45 percent in Delaware, Camden, New Castle, and Burlington, to 60 to 70 percent in Montgomery, to roughly double in Chester and Bucks, and more than double on the Main Line.
Taxes change across the river too, which matters for the total-cost column even where prices are similar. New Jersey counties carry the state's highest-in-the-nation effective property rates, about 1.88 percent on average with the largest average residential bills in the country (New Jersey Division of Taxation, verified September 2026). Delaware's New Castle County issued its first reassessment bills in decades in 2025, so recorded assessments are still adjusting (verified September 2026). The 'how much does this address actually cost' question therefore needs a per-parcel read in every state, not a county average.
What surprises someone moving from Boston
In Greater Boston, the city is the price anchor. Boston proper ran about $841,000 in the three months ending September 2026 (Redfin), above the outer towns, with Quincy at about $699,000 and Framingham at about $690,000, while the inner ring runs higher, with Newton around $1.55 million. The Greater Boston single-family median hit about $1,002,500 in August 2026 (Greater Boston Association of Realtors). If your mental model is 'the city is the premium and the first ring is the discount,' Philadelphia is the mirror: the city is the discount side of the gradient and the Main Line is the premium side.
Three things from a Boston budget land differently here. Massachusetts has no local income tax anywhere, so the wage tax mechanics in this post are a brand-new budget line for a Boston-area buyer. The city's transfer tax, 4.578 percent split near evenly, is a bigger closing number than the roughly 2 percent a suburban Pennsylvania sale carries. And the same budget behaves in reverse: in Boston, $700,000 sits near the city median and above the outer-town medians, while in Philadelphia it is well above the citywide median and roughly in the middle of Main Line territory. What flips is which side of the gradient your money lands on.
What most people get wrong
- That the city is cheaper because it offers less. The gap is structure: attached, older, smaller stock, a wage tax, and the region's highest transfer tax, all priced into listings. A citywide median also hides wide block-to-block spread, so the median says nothing about any single address.
- That a cheaper sticker is a cheaper year. Run the annual column: the city takes a wage cut from every paycheck and a 4.578 percent transfer tax at closing, and the suburbs offset lower transfer taxes with materially higher effective property rates. Which side wins depends on the income, the price, and the specific house.
- That the suburbs are uniformly expensive. Delaware County sits only about a quarter above the city, and the South Jersey counties sit closer still. The premium is concentrated, with the Main Line carrying the largest step.
- That the gap is a market cycle. The stock mix predates any cycle and the tax structure is set by city and state law. Gaps widen and narrow, but the gradient has pointed the same way for generations.
- That the city is the tax bargain because its property rate is low. The effective property rate is the region's lowest, and the city pairs it with a wage tax and the highest transfer tax in the region. 'Lower property rate' is not 'lower taxes overall.'
How to compare an address, not a city
Because medians hide the picture, use the per-address method. For every shortlisted property, pull five numbers: price and price per square foot; the annual property tax at that address, which in the city means the Office of Property Assessment value times 1.3998 percent, minus the $100,000 Homestead Exemption if you file, and in the counties means the assessed value times the local millage; the transfer tax you would write at closing; the wage tax or earned income tax you would pay if you or your partner works in the city; and the door-to-door commute. Compare the first-year and five-year totals, then the sticker. A CPA can run your tax columns; your broker and settlement attorney have the current numbers for a specific parcel.
Related reading
- Is it cheaper to live in Philadelphia or the suburbs?
- Do I pay Philly's wage tax if I live in the suburbs?
- Property taxes in New Jersey vs. Pennsylvania
- Rowhome vs. single-family house in Philadelphia
- City or burbs: how to choose where to land
- The Main Line: the rail suburbs at the top of the market
- Chestnut Hill: an in-city neighborhood guide